Applies to: Brands
Within Overview, you can use the following features to make cross-campaign reporting simpler, with a holistic view of campaign data all in one place. You can view campaign performance at an organization-level across all of your campaigns, across all publishers – and filter your results as desired.
Instructions
Filter your Overview reporting data by:
-
Custom Date Range
-
Daily or Weekly
-
Campaign Type (Reporting, Attribution)
-
Publisher
-
Campaign Name
Review Overview reporting data in each of the below views.
Scroll through the additional tabs to view filtered data at an organization level.
-
Frequency
-
Reach
-
Overlap
-
Players
-
Locations
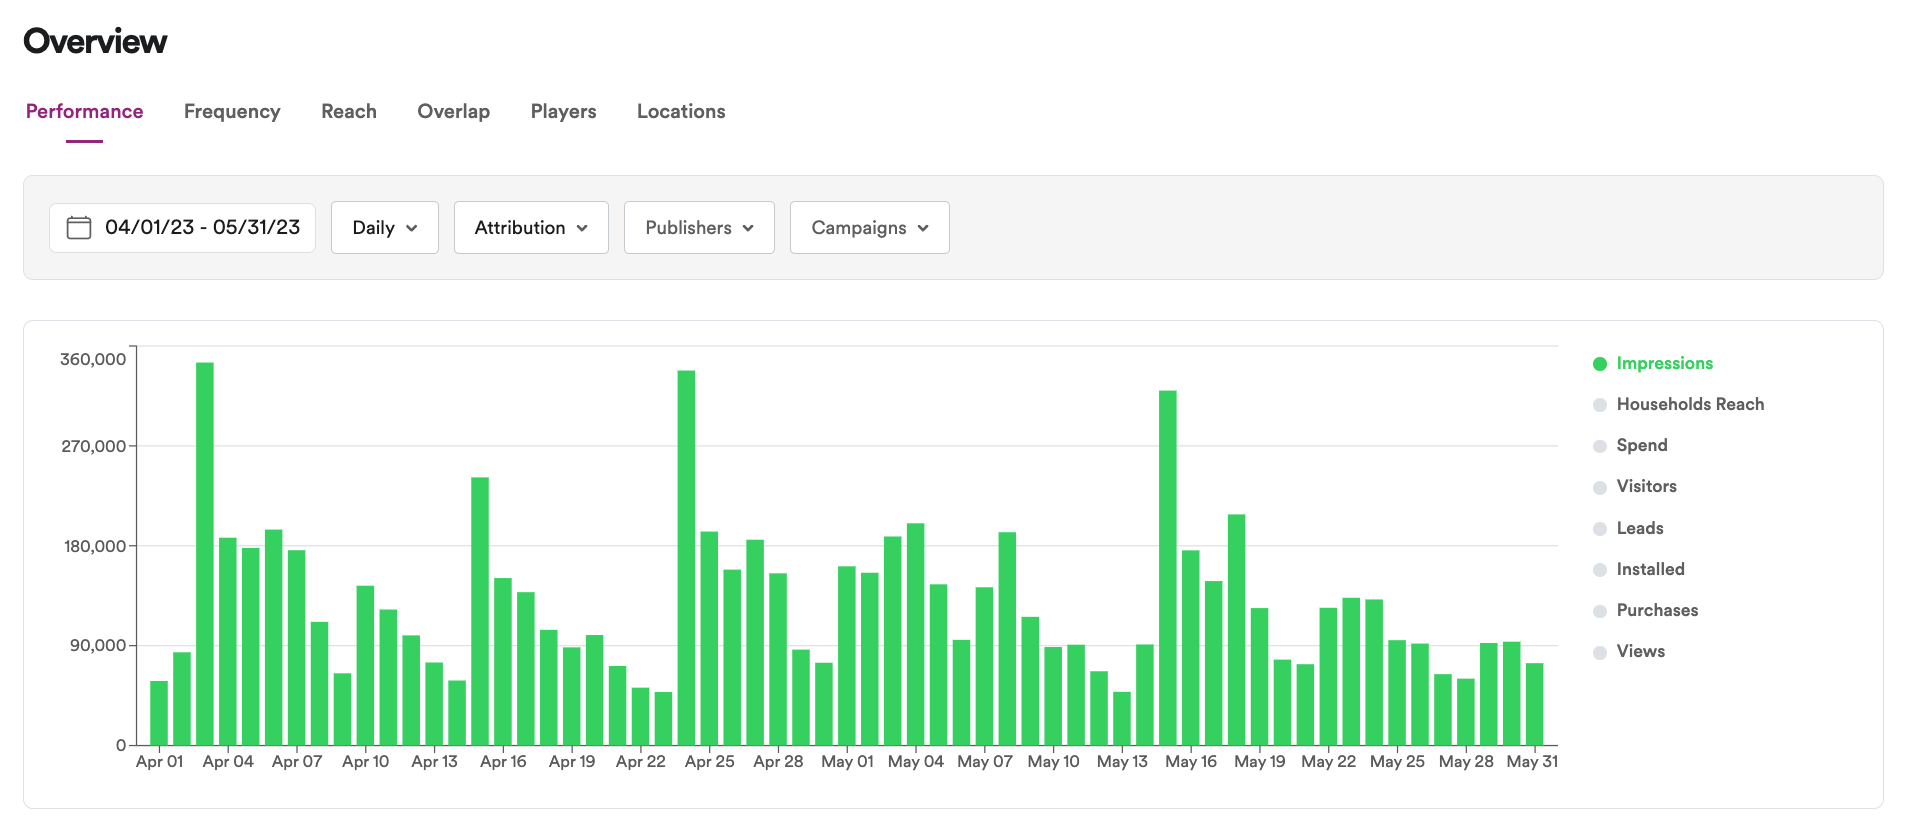
View #1: Performance Over Time
Once you have filtered your results, the first reporting visualization you will see is a bar graph, with a clickable metrics bar within the right rail of the graph. The metrics available on this rail are dependent upon the conversions being tracked during the time period selected.
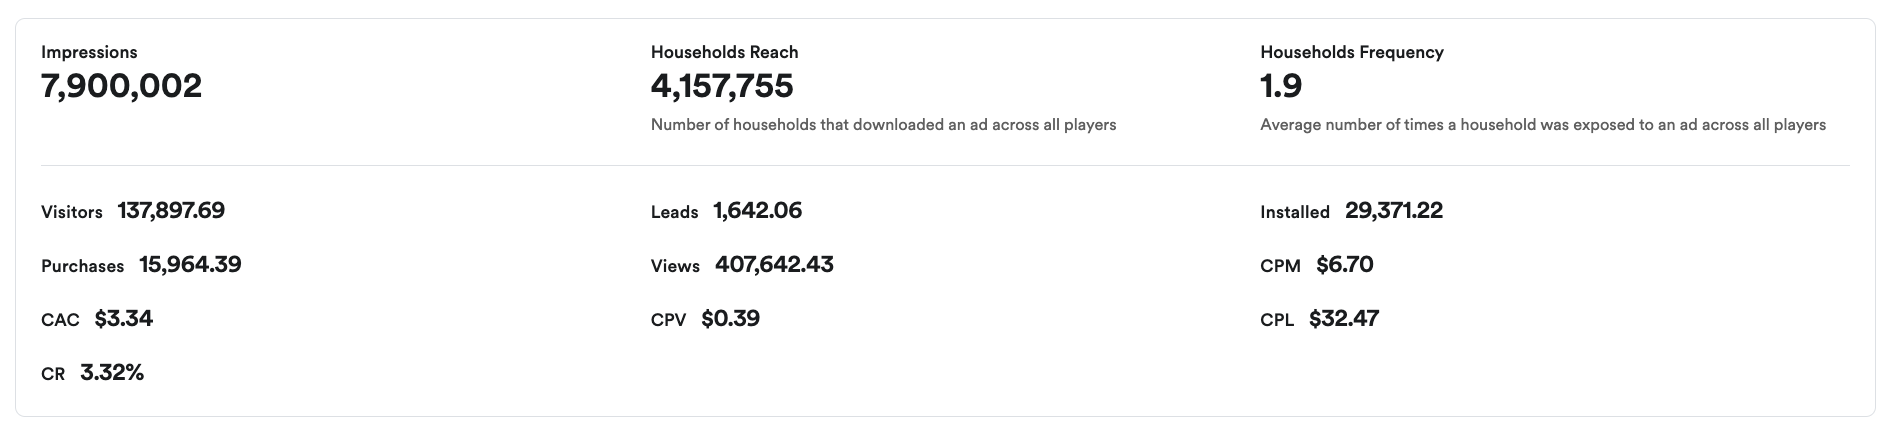
View #2: Performance Summary
Under your bar graph, you will see a summary tile (similar to what is seen in an individual campaign conversions tab). This summary tile will provide you with an aggregated view of campaign performance, per the selected filter.
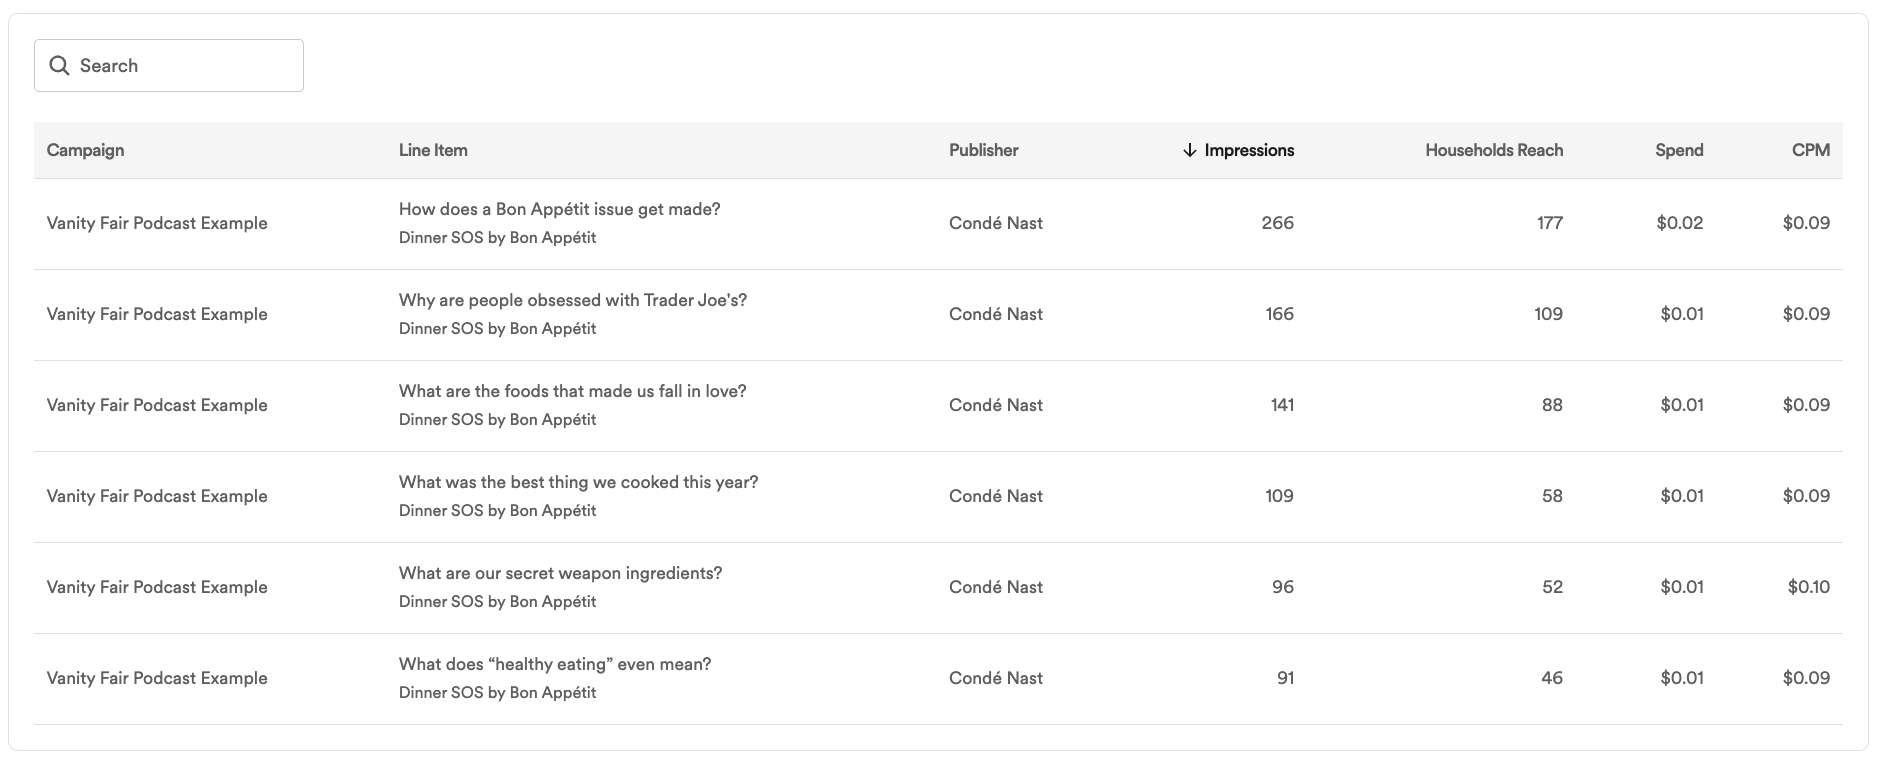
View #3: Reporting Table
At the bottom of the screen, you will see an itemized table that includes campaign reporting and the associated line items within.