Conversion Lift reports are designed to help advertisers understand consumer reaction after exposure to an ad. Conversion Lift captures the volume of site visitors who heard an ad, and compares it to a normal visitation volume of those not exposed to the ad. It zero’s out people who would be visitors regardless of advertising. This report is meant to demonstrate how your campaign is helping you lift your presence and marketing. It does not provide you with campaign conversion totals. You can learn more about Conversion Lift here.
Before you begin...
Before analyzing campaign results, make sure you have clear answers to the following questions.
- What was the campaign's primary KPI?
- What were the targeting tactics used across the media?
- What was the call-to-action in the creative?
- Which conversion events were activated for the Spotify Pixel?
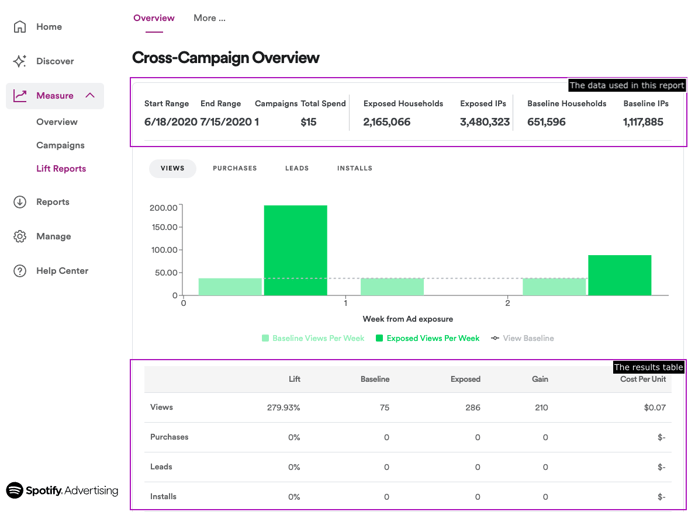
The Data Used in the Report
| Date range |
Timeframe of the impressions being measured in the report |
| Campaign count | Number of campaigns selected to be included in the report |
| Total Spend |
The calculated spend during the selected timeframe (impressions*eCPM)/1000 |
| Households vs. IPs |
Exposed Households - households (excludes mobile, non-household IPs) that match directly to a household in the device graph. Household Reach - includes mobile, non-household IPs, which are estimated. The baseline and exposed count of households vs. IPs are shown to provide transparency. While there may be multiple IPs associated to 1 household, there is a maximum of 1 household per IP. IPs change after 30 days, plus they are categorized and re-categorized constantly to provide us a more conservative and realistic households count. Each connected device has its own IP address, which are part of a main network IP address from an ISP provider., The average house in the U.S. now has 20.2 connected devices, according to a new report based on an analysis of 41 million homes and 1.8 billion connected devices. In Europe, the average is 17.4, while the average Japanese house contains only 10.3 smart devices (via Forbes 2022) |
The Results Table
| Events |
Views - sum of page views. This will be present in 100% of reports, as views are related to the main pixel script required for attribution to be functional Purchases, Leads, Installs - sum of pixeled purchase event(s). Purchase events are most commonly something like a checkout confirmation page. These are optional events. If there is no data related to an event, then it was not implemented by the Advertiser. This is part of the manual QA done by the person who runs the report. |
| Weeks from Ad exposure |
A simple visual that shows how far from exposure the conversion took place. For example, we see the highest # of conversions occur within the first week of exposure (week 0 to week 1), with a steady long-tail of activity. This supports what we know about podcast listener-behavior; they may not listen right away, and/or they may not take action (or take the expected action) right away. |
| Lift |
Lift is calculated by utilizing the below formula: ((Exposed - Baseline)/ Baseline)*100; using the example report above When your baseline is low or 0, this will contribute to a higher lift percentage. In these instances, we recommend looking at your Gain. |
| Baseline | Sample group of listeners within the Spotify Ad Analytics ecosystem that was not exposed to the ad and organically performed the conversion events |
|
Exposed |
Sample group of listeners from the selected campaigns that were exposed to the ad. Exposed households of the ip addresses that were exposed, how many of those were matched to the graph. |
| Gain |
|
| Cost Per Unit | Calculated cost of one gain using Total Spend. (Total Spend/ Gain)= Cost per Unit; Very unlikely that this would be a KPI; if a client is looking at CPA/CPU, they would rely on CR% rather than lift. |
Tips for Analysis
- Tease out relative performance – Lift is a metric that reflects % change. As a result, you will never see negative lift in Conversion Lift reporting. If there is no increase in metrics, the dashboard will show zeroes.
- Consider your baselines – It's important to always consider your sample size (n). If the sample size is too small, you will not be able to assess advertising impact.
- Compare Placements – Use the line item view, below the campaign overview module, to compare performance across placements. If you notice overall Lift is low, review the results of each placement to confirm if one tactic is bringing performance down.
- Evaluate Weeks from Ad Exposure – A downward trend of conversions is typical. Most often listeners take action soon after hearing an ad as recollection fades over time. However, for brands/products that require deeper consideration (e.g. automotive), you may see this Lift graph increase over time.
Frequently Asked Questions
- Why did my request report not populate?
Only campaigns that meet the conversion lift report requirements will appear in the drop down menu. If you do not see a campaign in the menu, it means that campaign does not have more than 250K impressions or it has not been live for at least 4 weeks. - Why is a line item missing from the report?
If a line item is not present in the report, then there is no data found for it. Most likely, that line item's impressions have fallen outside of the time frame selected. - In a Conversion Lift report, does the Campaign Overview account for the performance of specific line items?
Yes. Spotify Ad Analytics leverages a partial (or linear) attribution model, assigning even credit to each touchpoint or ad exposure. The campaign-level metrics take this into account when calculating overall Lift. - Can my lift report be exported?
Spotify Ad Analytics does not allow for lift reports to be exported. You can transfer the data into your own report, or take screenshots of the data presented.