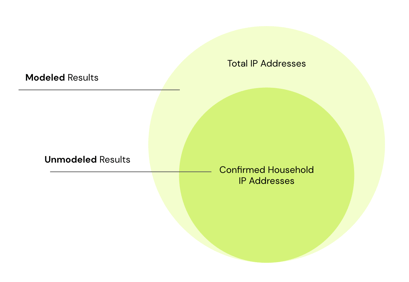
Spotify Ad Analytics models attribution results in order to provide a more comprehensive view of the impact of your campaign.
Before you dive in:
It's important to understand what data Spotify Ad Analytics is able to use for attribution and how we analyze attribution using a device graph.
What are modeled results vs. unmodeled results?
Using a device graph, Spotify Ad Analytics confirms the impressions in a standard attribution window based on confirmed household IP addresses. Additionally, IP addresses that are not ‘noisy’ (i.e. noisy IP addresses are those using a cell-tower or commercial connection) are analyzed in order to determine if they should be considered a household or not. When Spotify Ad Analytics determines impressions are not from a household, results are subsequently modeled so that your campaign's results provide additional insight into the effectiveness of its full reach and impact.

How does it work?
- Based on the total IP space captured through impressions/downloads, we project a multiple of additional conversions that would have also likely happened on the advertiser’s website had we been able to run standard attribution across all impressions.
- The multiplier will vary for each line-item as it is based on the amount of non-noisy IP data we can use for attribution and the amount of noisy IP data discarded.
- The multiplier is calculated by taking the unique number of total IP addresses and dividing it by the unique number of household IP addresses.
